This video gives a quick tour of the MSAI Connect menu interface and how it acts as the central hub for monitoring and analysis. It shows how a clean, intuitive design makes it easy to access multi-sensor data, spot issues early, and take action fast - all from a single interface that supports smarter, more proactive maintenance.
0:00
Discover MSAI Connect’s user-friendly menu interface, which assists users in capturing thermal data in real time to streamline production and enhance reliability programs.
0:11
After logging in, the MSAI Connect platform loads the home dashboard where users can access map information, see site status, and review recent alerts. Click on an alarm to gain insights into the event. Notifications can be accessed and managed from any dashboard.
0:24
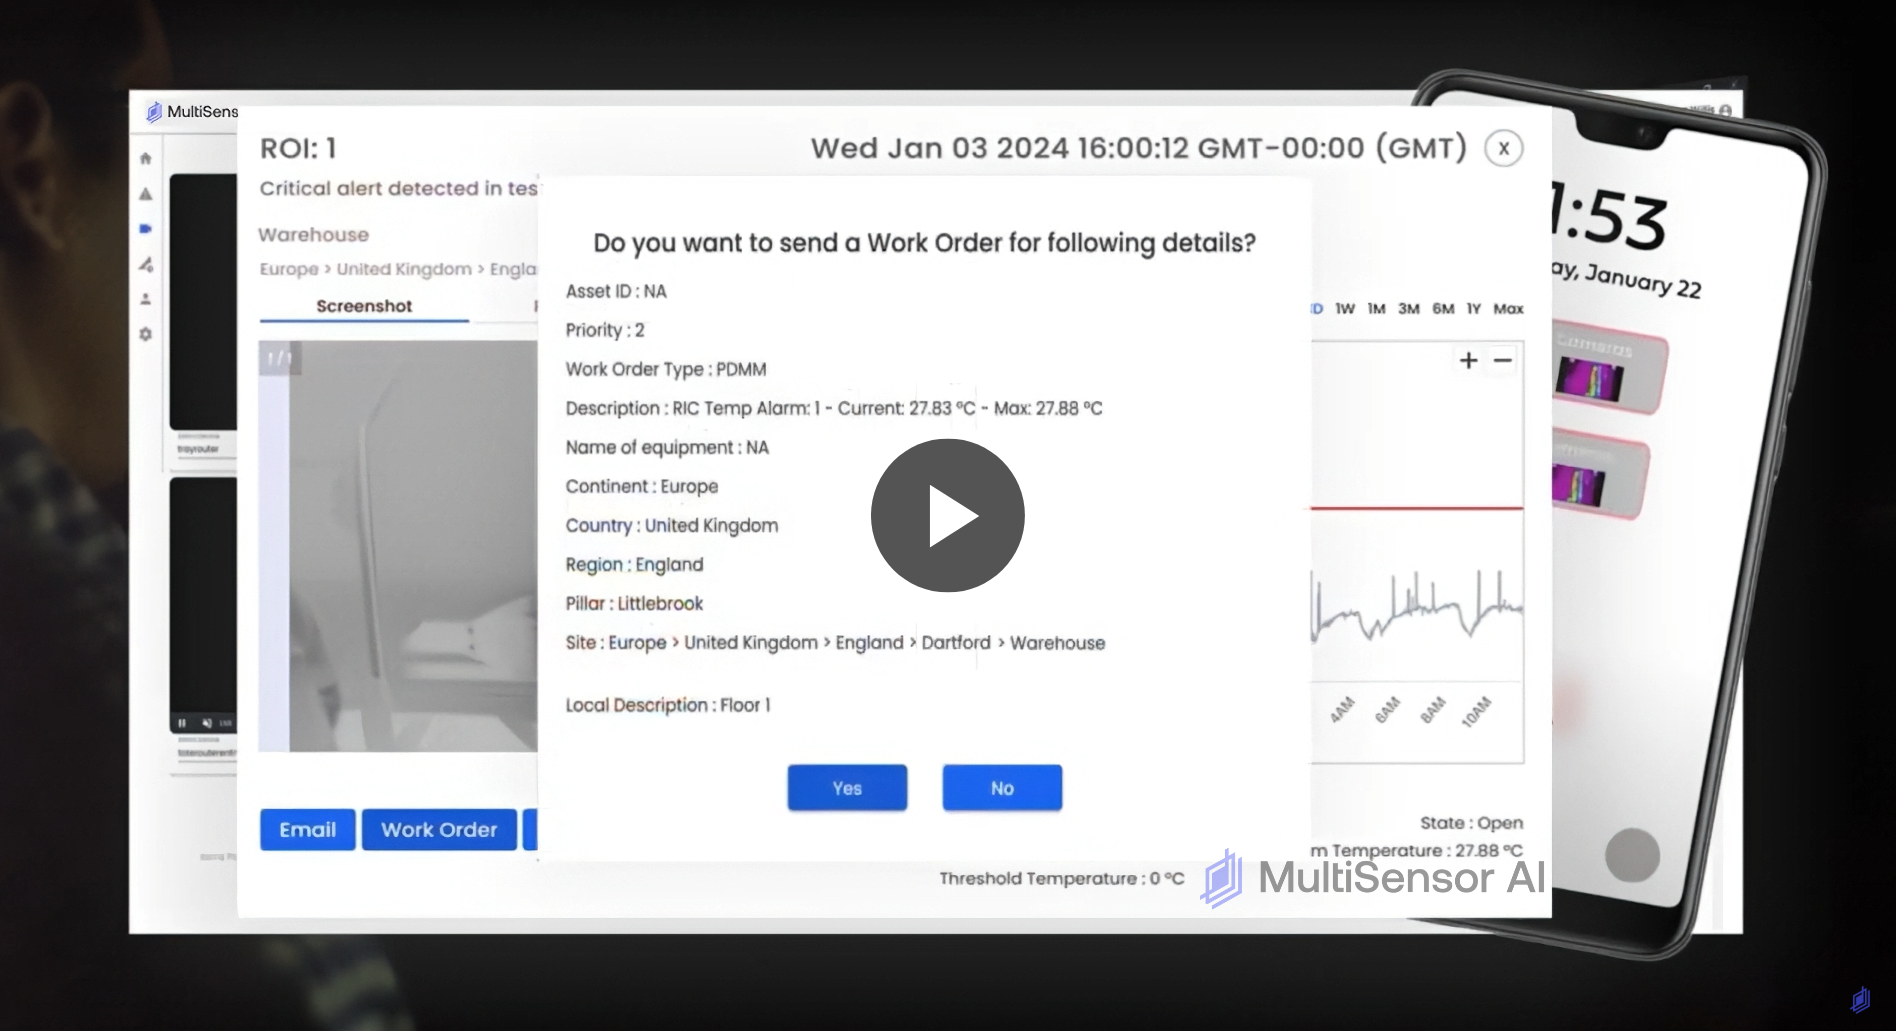
Alert events are generated and stored on the Alerts dashboard. A range of filters are available for sorting alerts, and users may export data in CSV format. Click on an alarm to gain insight, send an email, request a work order, and more.
0:40
The Workstation dashboard hosts live video feeds in a customizable grid format. A red box shows a video under alert condition.
0:47
Check the status of remote monitoring sensors on the Devices dashboard. Green interfaces are active and red interfaces are inactive.
0:53
Adjust alert settings, select units, enable multifactor authentication, and set storage for the playback archive with the User Preferences dashboard.
1:03
Manage user profiles and roles, as well as device and site onboarding, with the Settings dashboard.
1:06
Thank you for viewing this instructional overview video for the MSAI software application. Visit us at www.multisensorai.com.